Snow, Catenary, and a Confident Wrong Turn: Geolocating a Train Window
A single blurry photo shot from a moving train. The deduction chain landed on the right country in the first thirty seconds — and then I talked myself out of it for three hours. A GEOINT writeup about tool-induced hallucination in data-sparse regions.
The challenge
Standard “where was this” format from the 24-7-Players Discord:
Find this location and provide the closest 360 image you can find. Any 360 image within 150m will be accepted as the flag. Closest answer within 24 hours wins, if correct flag is not found.
The image: a snowy rural valley shot from a moving train, through the window, over a viaduct. A catenary pole splits the frame. Mountains in the back, a village with greenhouses across a floodplain, a braided stream in the foreground snow.
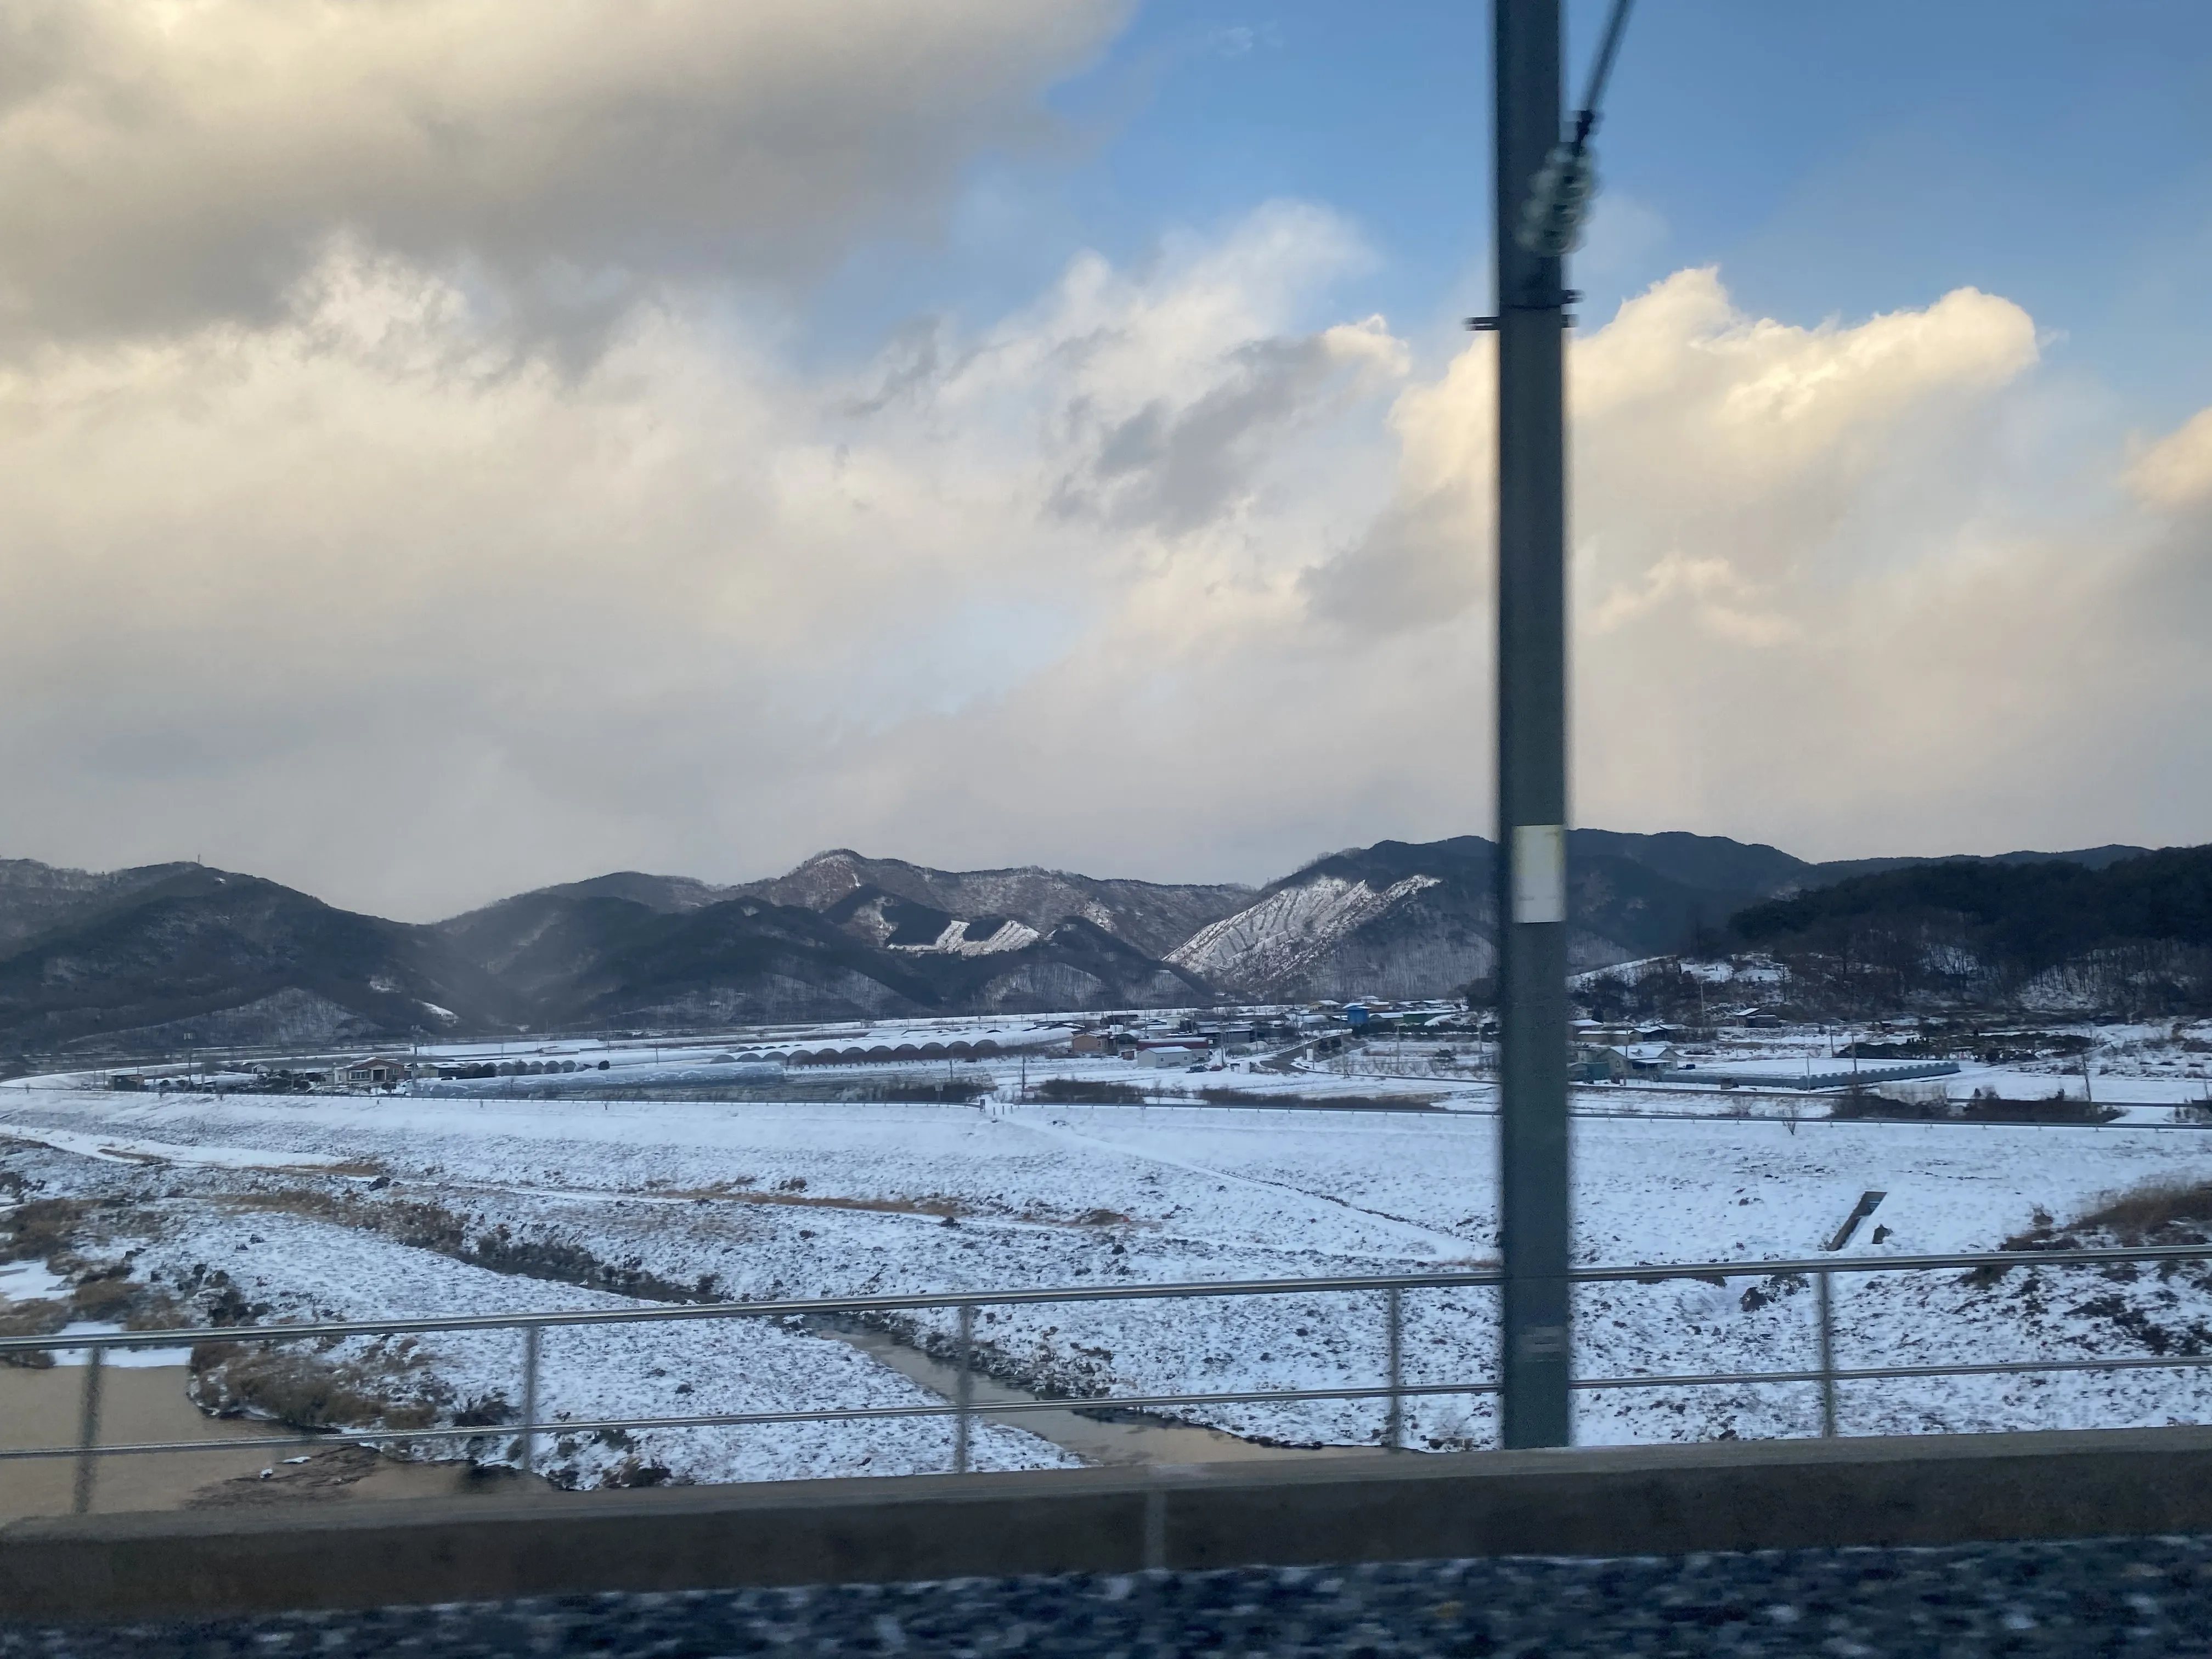
Catenary, viaduct parapet, greenhouses, colored tin roofs, pale slope scars — the thirty-second read that was right before any tool got involved.
Up front, because a writeup isn’t a thriller: the spot is the Gyeongbu Line crossing the Geum River floodplain at Simcheon-myeon, Yeongdong — 36.2308, 127.7009, South Korea. My first read had the right country in thirty seconds. The next three hours are the reason this writeup exists.
The flag format matters more than it looks — hold that thought.
First read (the part I got right)
Thirty seconds of looking gave a clean set of features:
- Vinyl greenhouses (the white tunnel rows) — high-density rural agriculture, very East Asian.
- Colored metal roofs on the village houses — blue/green painted tin, a rural Korea signature.
- Shot from an electrified railway on a viaduct — overhead catenary, concrete parapet, motion blur, window reflection. Not a branch line; a mainline.
- Moderate forested mountains set back behind a broad, flat valley floor — inland, not coastal.
- Pale scars on the mid-slope — irregular light streaks on the dark forest. The single most distinctive fingerprint.
My first written call was South Korea, Gangwon-do region, with the Jungang Line (중앙선) as a candidate. That call was correct. Remember it.
The deduction chain
The catenary is load-bearing. The photo unambiguously shows overhead electrification, which lets you eliminate entire rail networks:
- Among snowy inland lines, non-electrified diesel lines drop out immediately.
- The line must be electrified — that’s a hard visual constraint, not a vibe.
Combined with the terrain (broad snowy basin, moderate backdrop mountains, greenhouse village at the foot of the slope), you’re looking for: an electrified mainline crossing a wide river floodplain, village + greenhouses on the far bank, a ridgeline with pale erosion scars behind.
That’s a rare, enumerable pattern. Good. This is where it should have ended.
Where it went wrong
I ran the image through Picarta (a trained geolocation model). It returned a ranked list:
1. Hiroshima-shi, Japan (34.38, 132.45)
2. Hofu, Japan
3. Wakimachi, Japan
4. Okayama-shi, Japan
...
8. Okcheon, South Korea   <- the one I ignored
Almost the entire list clustered in Chūgoku, Japan. One lonely South Korean outlier at the bottom.
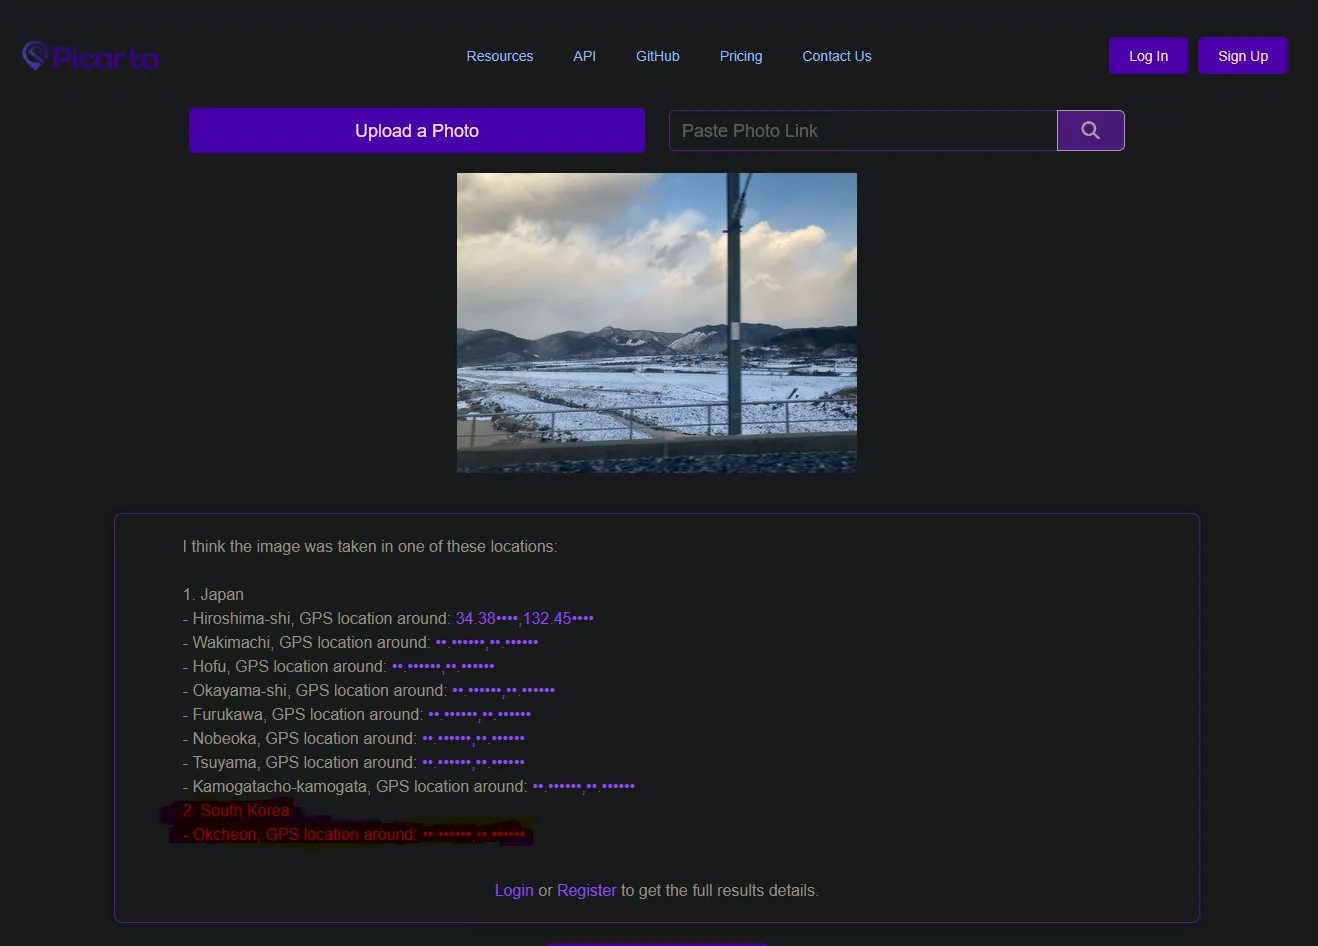
The Japan cluster is a coverage artifact — the lonely Korean outlier at rank 8 was Picarta telling the truth exactly once.
I built a whole theory on the Japan cluster:
- “Picarta is a trained model, so its cluster outweighs LLM vibes.” Two other models had also drifted toward Japan, so it felt corroborated.
- “The flag is a Google Street View / photosphere link. Rural South Korea has no Google Street View (the map-data export ban). Therefore the answer must be somewhere with Google coverage → Japan.”
From there I deduced the line brilliantly — and in the wrong country. Catenary → only the Hakubi Line (伯備線) is electrified among snowy Chūgoku lines → the snowy Hino River valley in Tottori. I spent hours driving that valley in Street View, matching ridgelines against a place the photo was never taken.
Both pillars of the theory were rotten:
- The flag was never a Google link. The challenge was resolved by closest guess — no exact flag was found. My premise (“flag = Google SV → not Korea”) was fabricated. And separately, South Korea’s Google Street View coverage is actually fine now (the Feb 2026 data-export deal, plus years of user photospheres). I was reasoning from a stale fact.
- Picarta’s Japan cluster was an artifact, not a signal. This is the real lesson. Picarta is trained on street-level imagery. South Korea, in that training distribution, is comparatively data-sparse — Google’s car coverage was historically thin and the dominant street-level data lives in Naver/Kakao, outside typical training sets. A trained geolocator can’t place a Korean scene in Korea if it never learned Korean streets — so it maps the scene onto the nearest data-rich analog: Chūgoku, Japan. The “Hiroshima/Okayama” cluster wasn’t the model recognizing Japan. It was the model failing to recognize Korea and projecting the error onto its nearest neighbor.
The single correct data point — Okcheon, the outlier I dismissed as noise — was Picarta telling the truth exactly once, and I read past it.
Ground truth
The author later pinned the actual spot via a Kakao short link:
- ~36.2308, 127.7009 — Simcheon-myeon, Yeongdong-gun, Chungcheongbuk-do, South Korea.
- Gyeongbu Line (경부선) — electrified — crossing the Geum River (금강) floodplain.
Broad basin, greenhouses on the far bank, electrified mainline over a braided river. It matches the photo like a glove. And it’s ~150km south of Gangwon-do, where I’d sent myself looking.
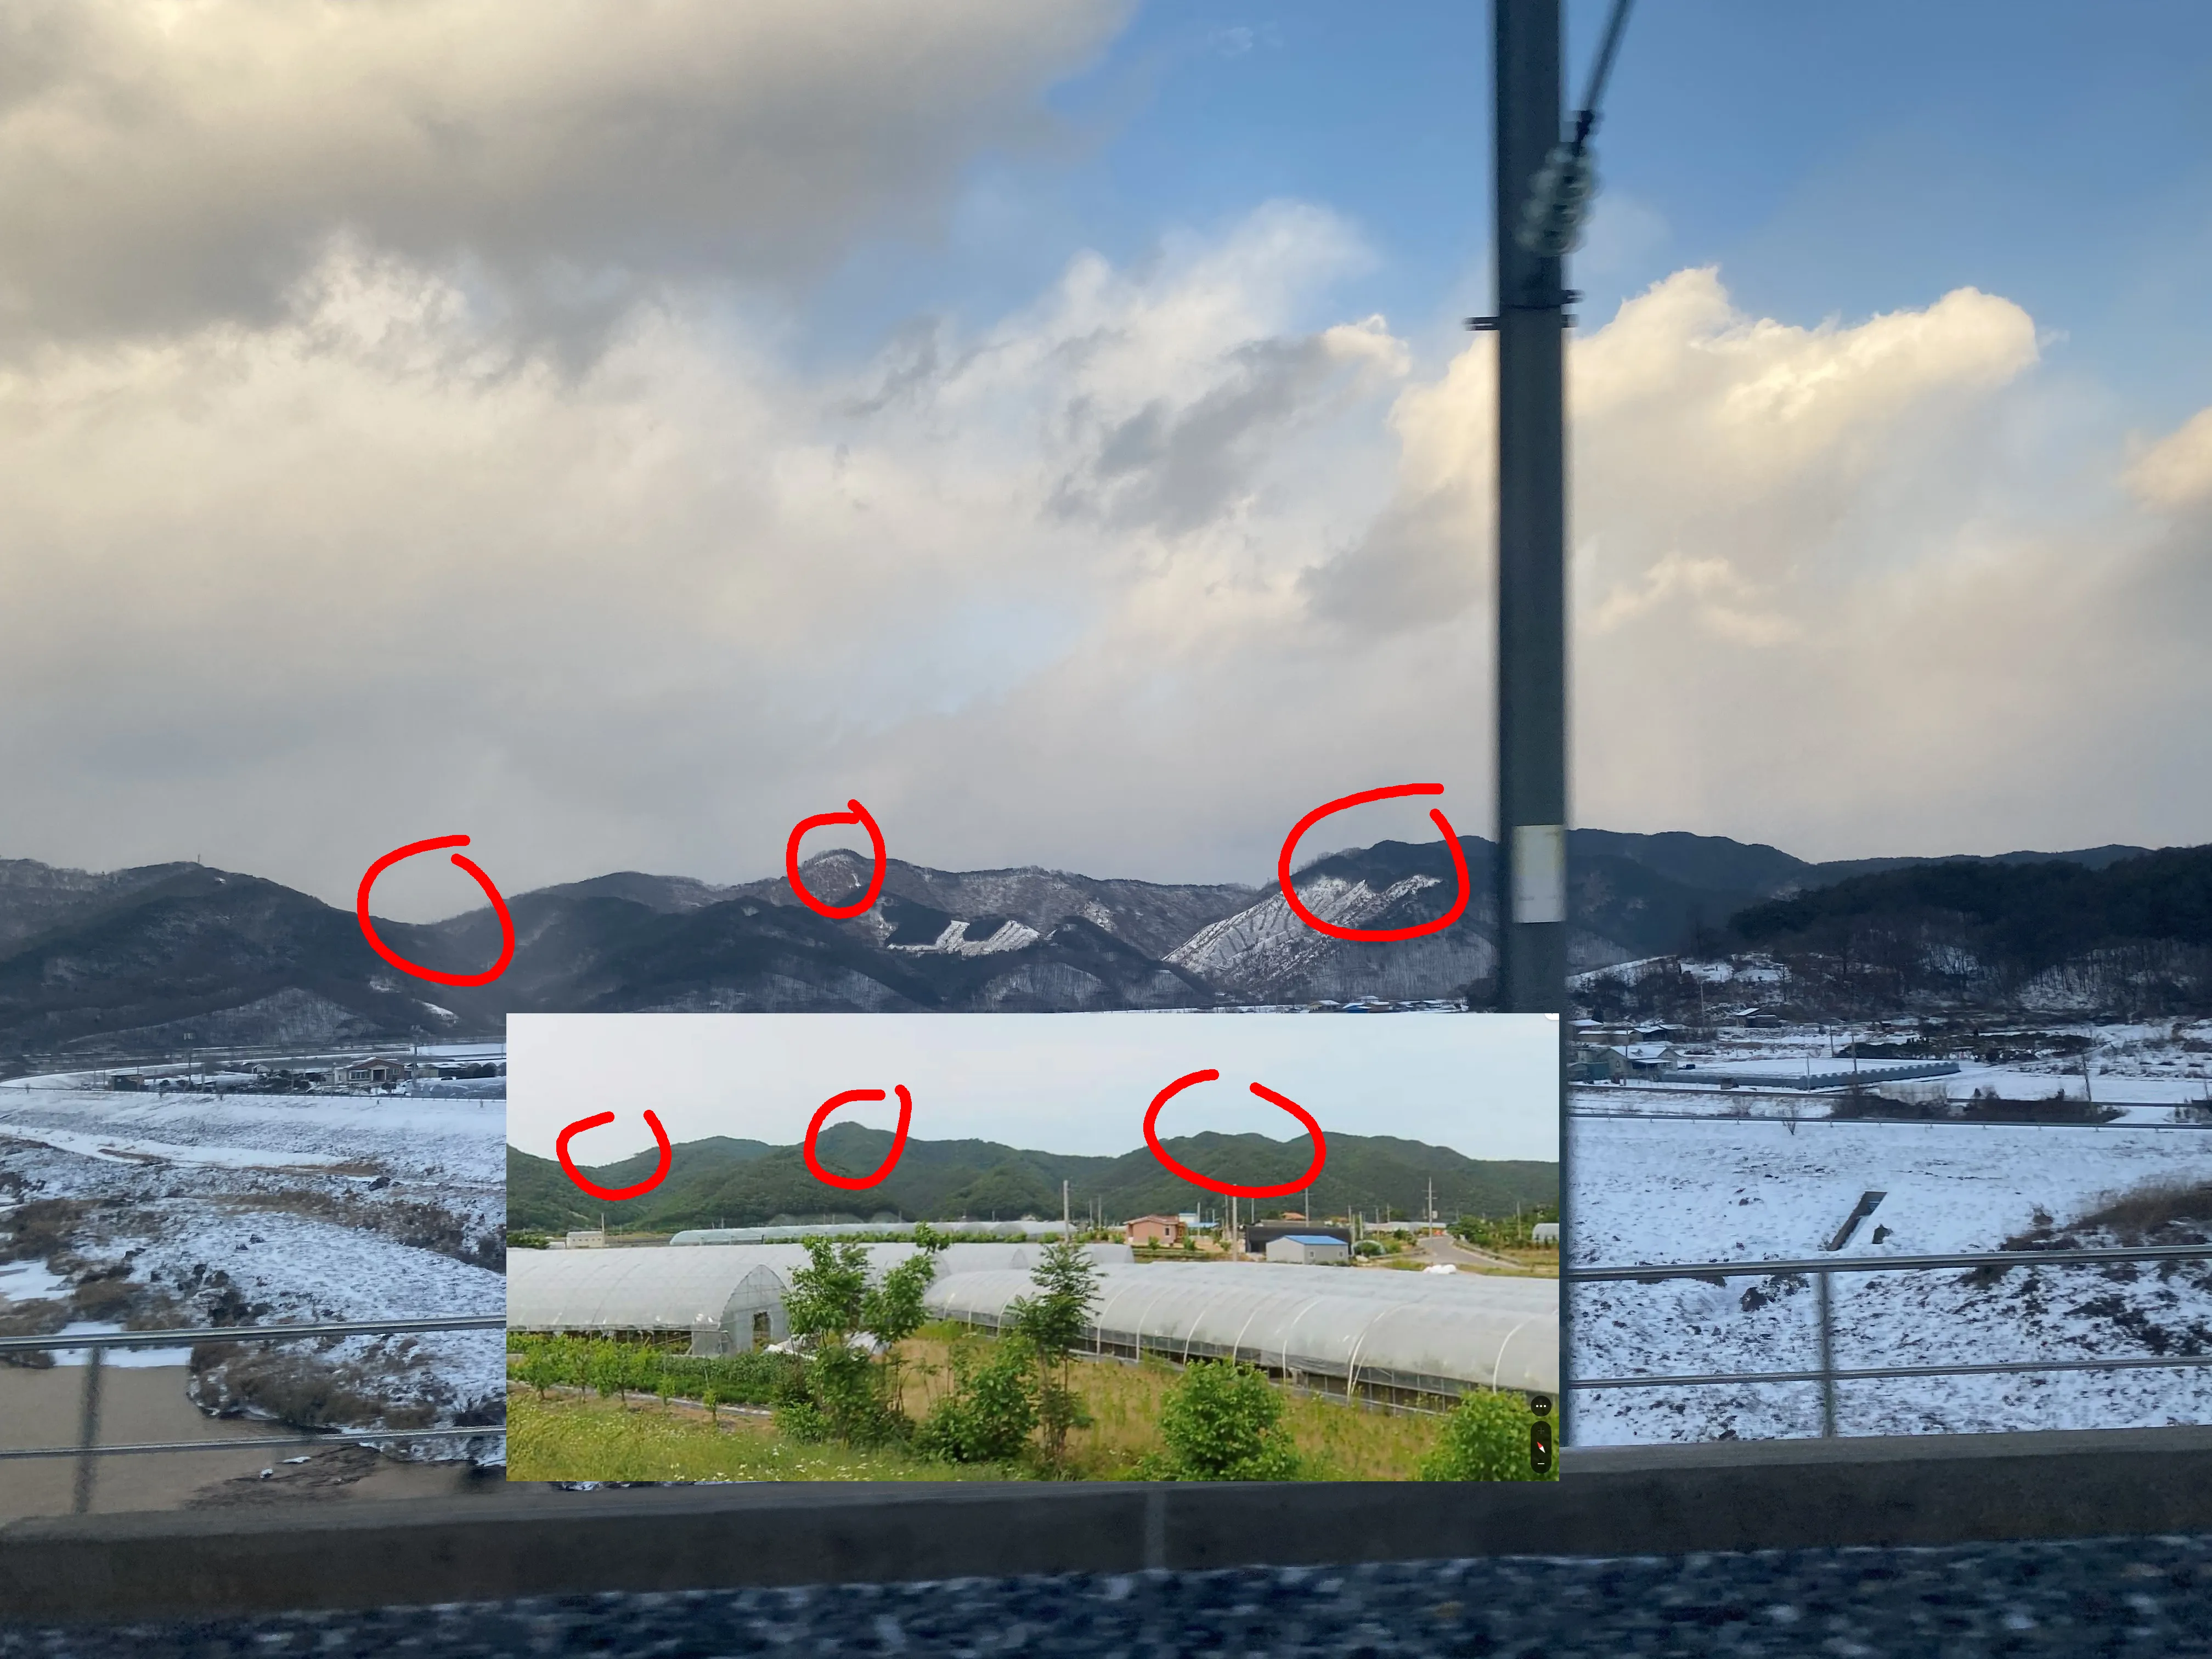
Broad basin, greenhouses on the far bank, braided river under an electrified mainline — the constellation matches feature for feature.
My catenary deduction was right the whole time. The country was right in the first thirty seconds. I overwrote a correct visual read with a confident theory built on two unchecked premises.
Lessons
Three, in order of how much they cost me:
-
In a geolocation model’s output, the outlier is often the answer — not the cluster. Especially when the cluster sits in a data-rich country and the outlier sits in a data-sparse one. The intuitive move (trust the dense cluster) is exactly backwards when the target region is underrepresented in training data.
-
Trained geolocators hallucinate confidently in data-sparse regions. For a Korea / Central Asia / much-of-Africa scene, the model’s output isn’t merely weak — it’s systematically displaced into the nearest data-rich neighbor. Treat a tool’s confident foreign cluster as a possible artifact of coverage, not as evidence.
-
Never let an argument overrule your direct visual read unless its premises are bulletproof. My “must be Japan” chain rested on “the flag is a Google link” — a premise I never verified and which was false. The catenary deduction (electrified line) never required Japan at all. When a clever inference contradicts what you can plainly see, audit the inference first.
Tooling notes
For the next Korean rail geolocation, the correct stack:
- OpenRailwayMap to trace lines — it color-codes by electrification, so the catenary constraint becomes a filter you can see. Red = electrified, black = diesel.
- OpenStreetMap (feature/Overpass search) for the geometry: railway + bridge + waterway + farmland, bounded to a corridor. Greenhouses tag inconsistently — don’t over-constrain on them.
- Kakao 로드뷰 / Naver 거리뷰 for the actual 360 matching — the dense native sources in Korea. Google Earth photospheres as a cross-check.
- The pinned spot rarely has roadview on it (rail viaducts aren’t driven) — which is precisely why the flag format is “any 360 within 150m.” You find the nearest covered road, not the exact point.
Sources
- Picarta — the geolocation model whose cluster misled and whose outlier was right
- OpenRailwayMap — electrification-coded rail network
- OpenStreetMap / Overpass Turbo — corridor geometry
- Kakao Map — the author’s ground-truth pin and roadview
- Naver Map — Korean street-level imagery
- Challenge: 24-7-Players Discord (private server, no public link)
Verdict: solved the country in thirty seconds, lost the plot for three hours, learned more from the wrong turn than the answer.